The air quality index map los angeles gives you a helpful starting point for understanding the air around your home, and testing your indoor air quality isn't complicated — but knowing which method matches your situation makes all the difference. This page covers the most effective ways to test IAQ in your LA home, what the results actually mean, and the steps that protect your family once you have answers.
TL;DR Quick Answers
air quality index map los angeles
The two most reliable AQI maps for Los Angeles are the South Coast AQMD Current Air Quality Map (aqmd.gov) and the EPA's AirNow Interactive Map (airnow.gov). Use both together for the most complete picture of current conditions:
South Coast AQMD (aqmd.gov/home/air-quality/current-air-quality-data) — Neighborhood-level AQI readings at more than 1,000 locations across LA, Orange, San Bernardino, and Riverside counties. The most granular real-time map available for the LA basin.
EPA AirNow (airnow.gov) — Federally verified ozone and PM2.5 readings updated hourly by zip code across greater Los Angeles.
One thing no AQI map will tell you: what your family is breathing indoors. Indoor pollutant concentrations are often 2 to 5 times higher than outdoor levels. Monitoring outdoor AQI is a starting point — testing your indoor air is what actually protects your household.
Top Takeaways
Outdoor AQI data does not tell the full story. Indoor pollutant concentrations are often 2 to 5 times higher than outdoor levels — and sometimes more than 100 times higher. Closing your windows during a high-AQI day helps. It does not eliminate the VOCs, fine particulates, and combustion byproducts already inside your home.
LA homes face a uniquely layered air quality challenge. Five factors combine to create indoor conditions more complex than virtually any other metro in the country:
Wildfire smoke infiltration
Ground-level ozone from traffic and heat
Santa Ana wind-driven particulates
Aging housing stock with legacy pollutants
Year-round warm temperatures that accelerate off-gassing
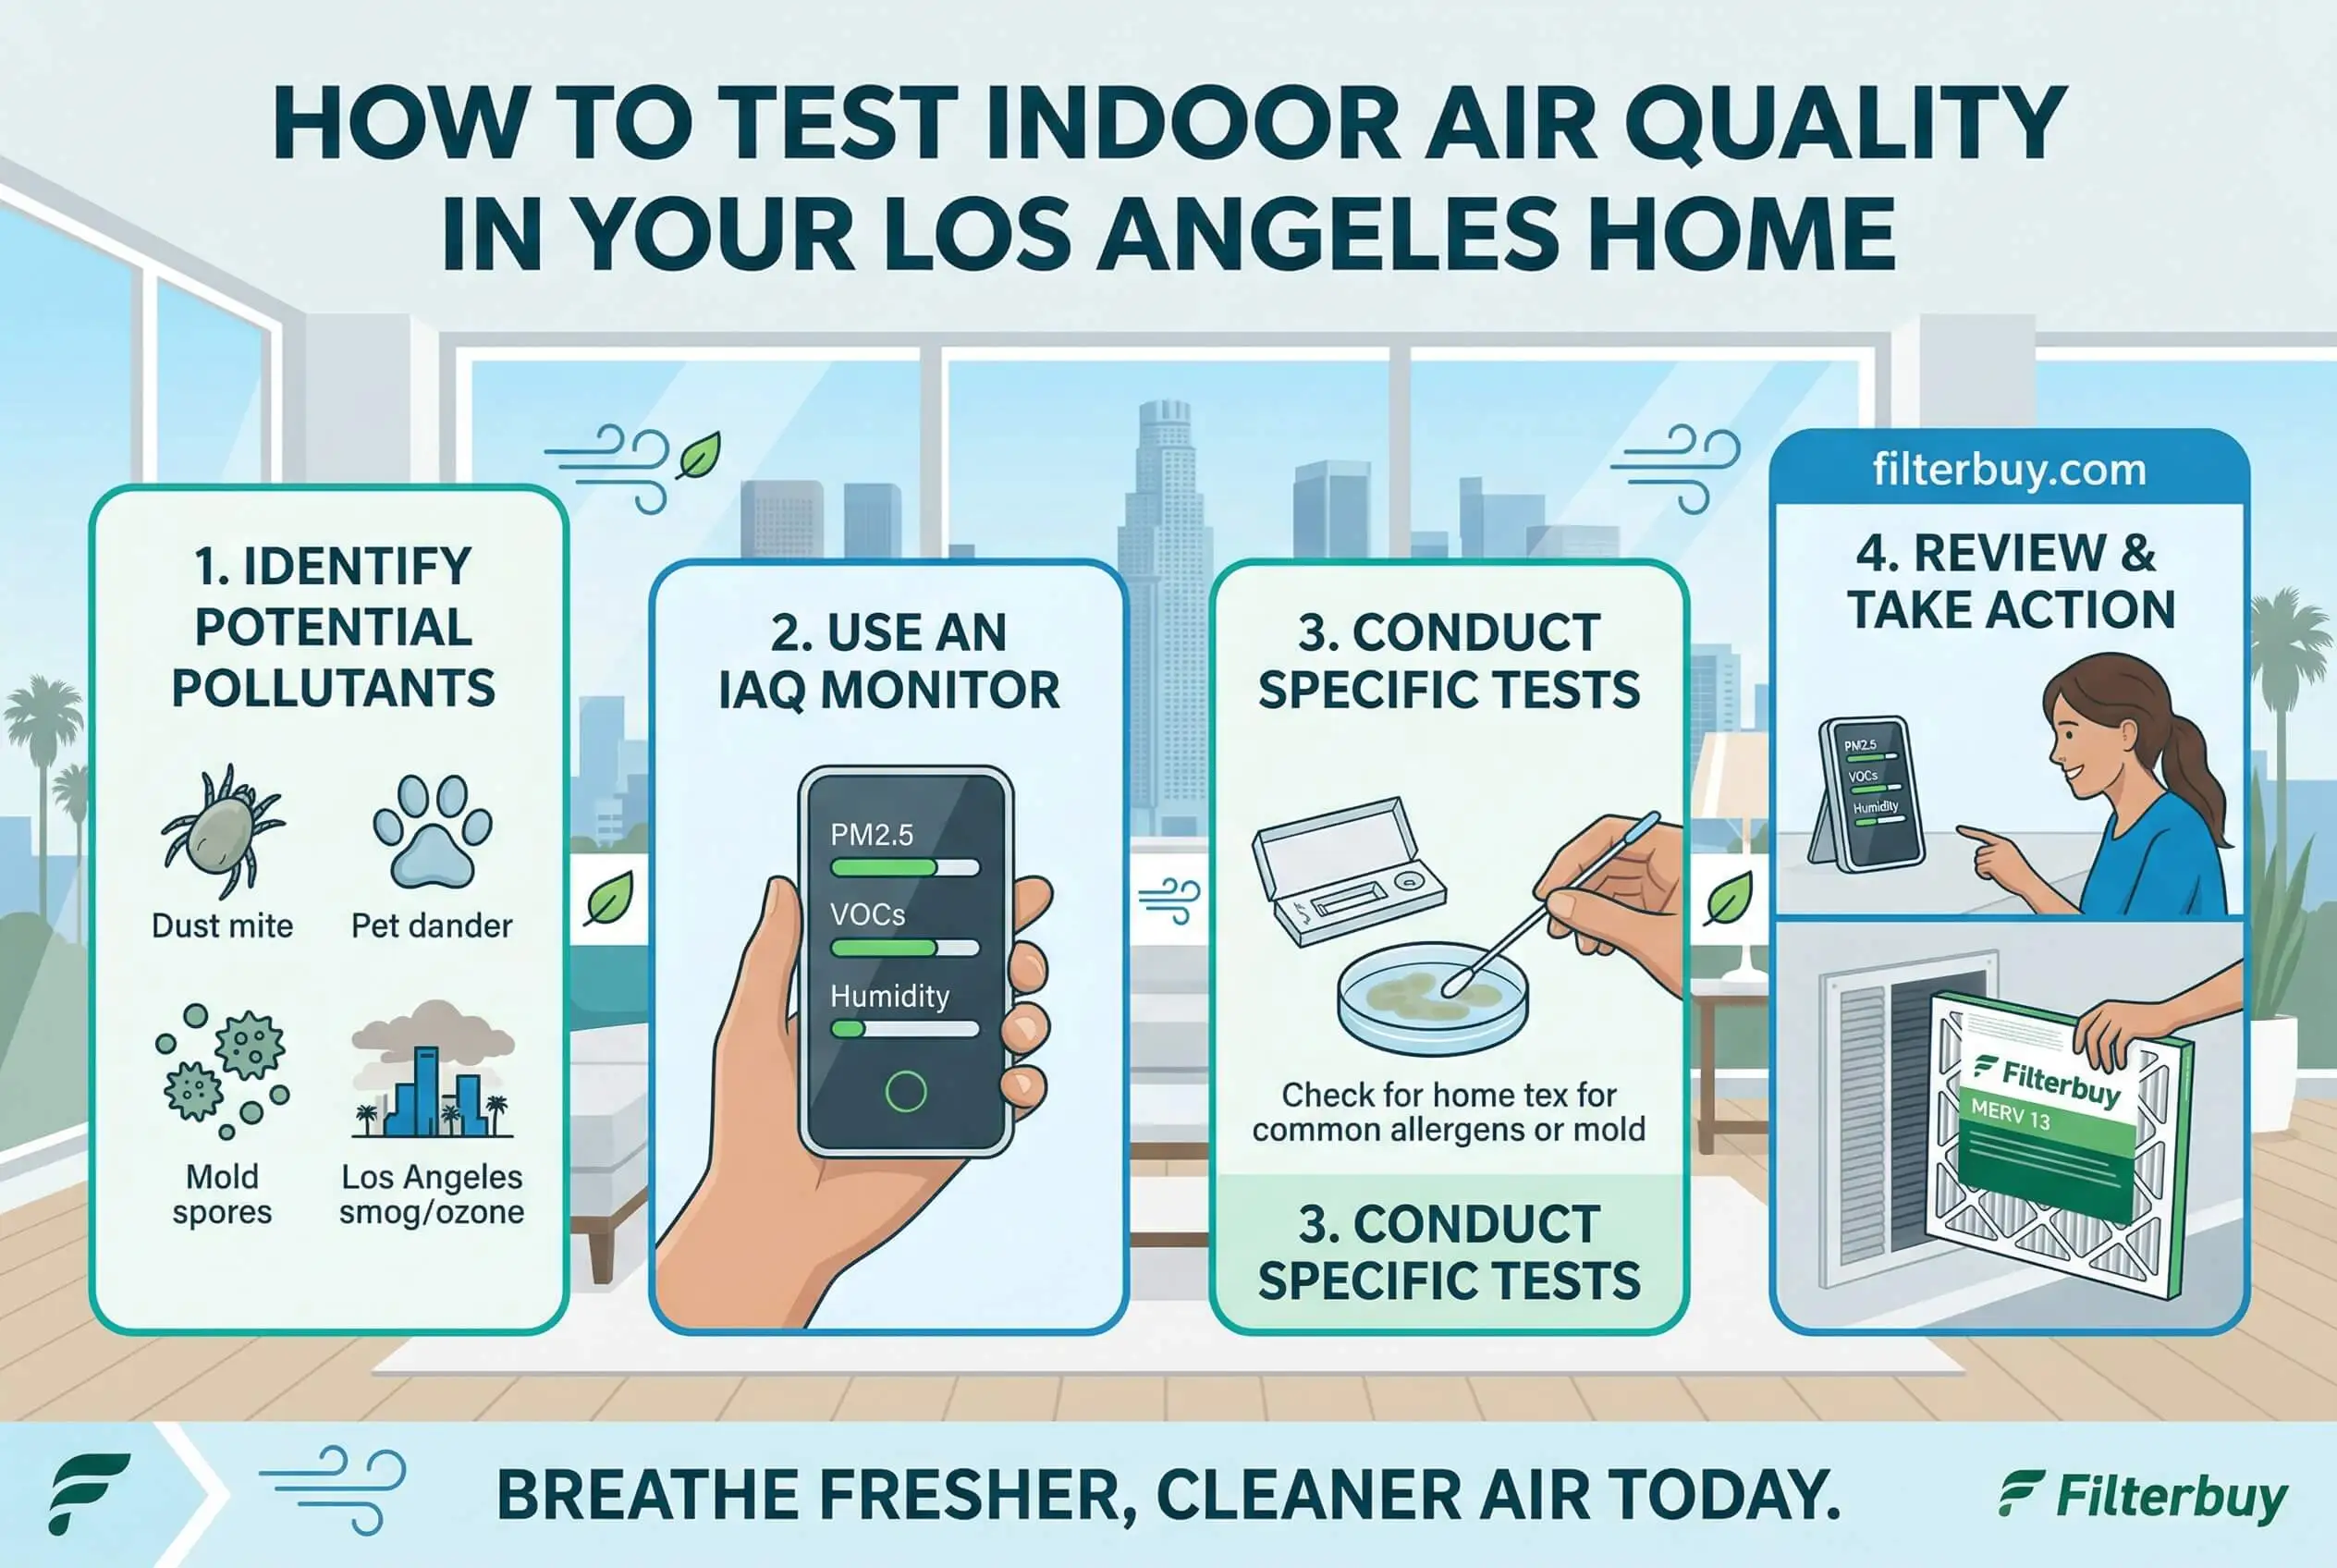
Test first. Then act. The homeowners who protect their families most effectively are not the ones with the most expensive equipment — they are the ones who tested, understood the results, and responded with targeted action. Match the right test to your specific risk profile:
IAQ monitor for real-time PM2.5, VOC, CO2, and humidity readings
Home test kits for mold, radon, formaldehyde, and asbestos
Professional assessment for persistent symptoms or post-wildfire recovery
Small, consistent actions deliver the strongest long-term protection. Four habits make the biggest difference:
Upgrade to MERV 13 filtration and change filters more frequently during fire season
Monitor PM2.5 levels in real time during high-AQI periods
Test for radon if you live on a hillside or in a high-risk soil area
Schedule professional IAQ assessments after major smoke events
Clean air is the foundation of a well-maintained home — not a feature of one. After over a decade of manufacturing filters and serving more than two million households, the families who breathe the cleanest air indoors share one trait: they stopped assuming their air was fine and started verifying it.
Why Los Angeles Homes Face a Unique Indoor Air Quality Challenge
Living in Los Angeles means living under one of the most complex outdoor air pollution profiles in the United States. But the air outside your home is only part of the story. In our experience manufacturing filters for over a decade and serving millions of households, we've found that LA homes tend to trap and concentrate pollutants indoors at rates that surprise even the most attentive homeowners.
Several factors make LA's indoor air quality challenge distinct:
Wildfire smoke infiltrates homes through gaps in doors, windows, and HVAC systems, depositing fine particulate matter (PM2.5) that lingers long after smoke clears outside.
Ground-level ozone and traffic exhaust from one of the most congested urban corridors in the country enter through ventilation systems and open windows.
Dry Santa Ana winds carry pollen, dust, and desert particulates across the basin — directly into your living spaces.
Older housing stock, common throughout LA County, often harbors legacy pollutants: lead paint dust, deteriorating insulation, and mold from decades of minimal ventilation.
Knowing what you're dealing with starts with testing. Here's how to do it right.
What Are the Warning Signs of Poor Indoor Air Quality?
Your home often gives you signals before a test confirms the problem. Based on patterns we've seen across millions of customer interactions and common indoor air quality tips, these are the most common indicators that LA homeowners report before testing reveals elevated pollutant levels:
Persistent allergy or asthma symptoms that worsen indoors
Musty or stale odors that don't resolve with cleaning or ventilation
Visible dust accumulation on surfaces within days of cleaning
Headaches, fatigue, or irritated eyes that ease when you leave the house
HVAC filters that appear heavily loaded well before their scheduled change date
If any of these sound familiar, your air is telling you something. Testing confirms it — and gives you a clear path forward.
Method 1: Use an Indoor Air Quality Monitor
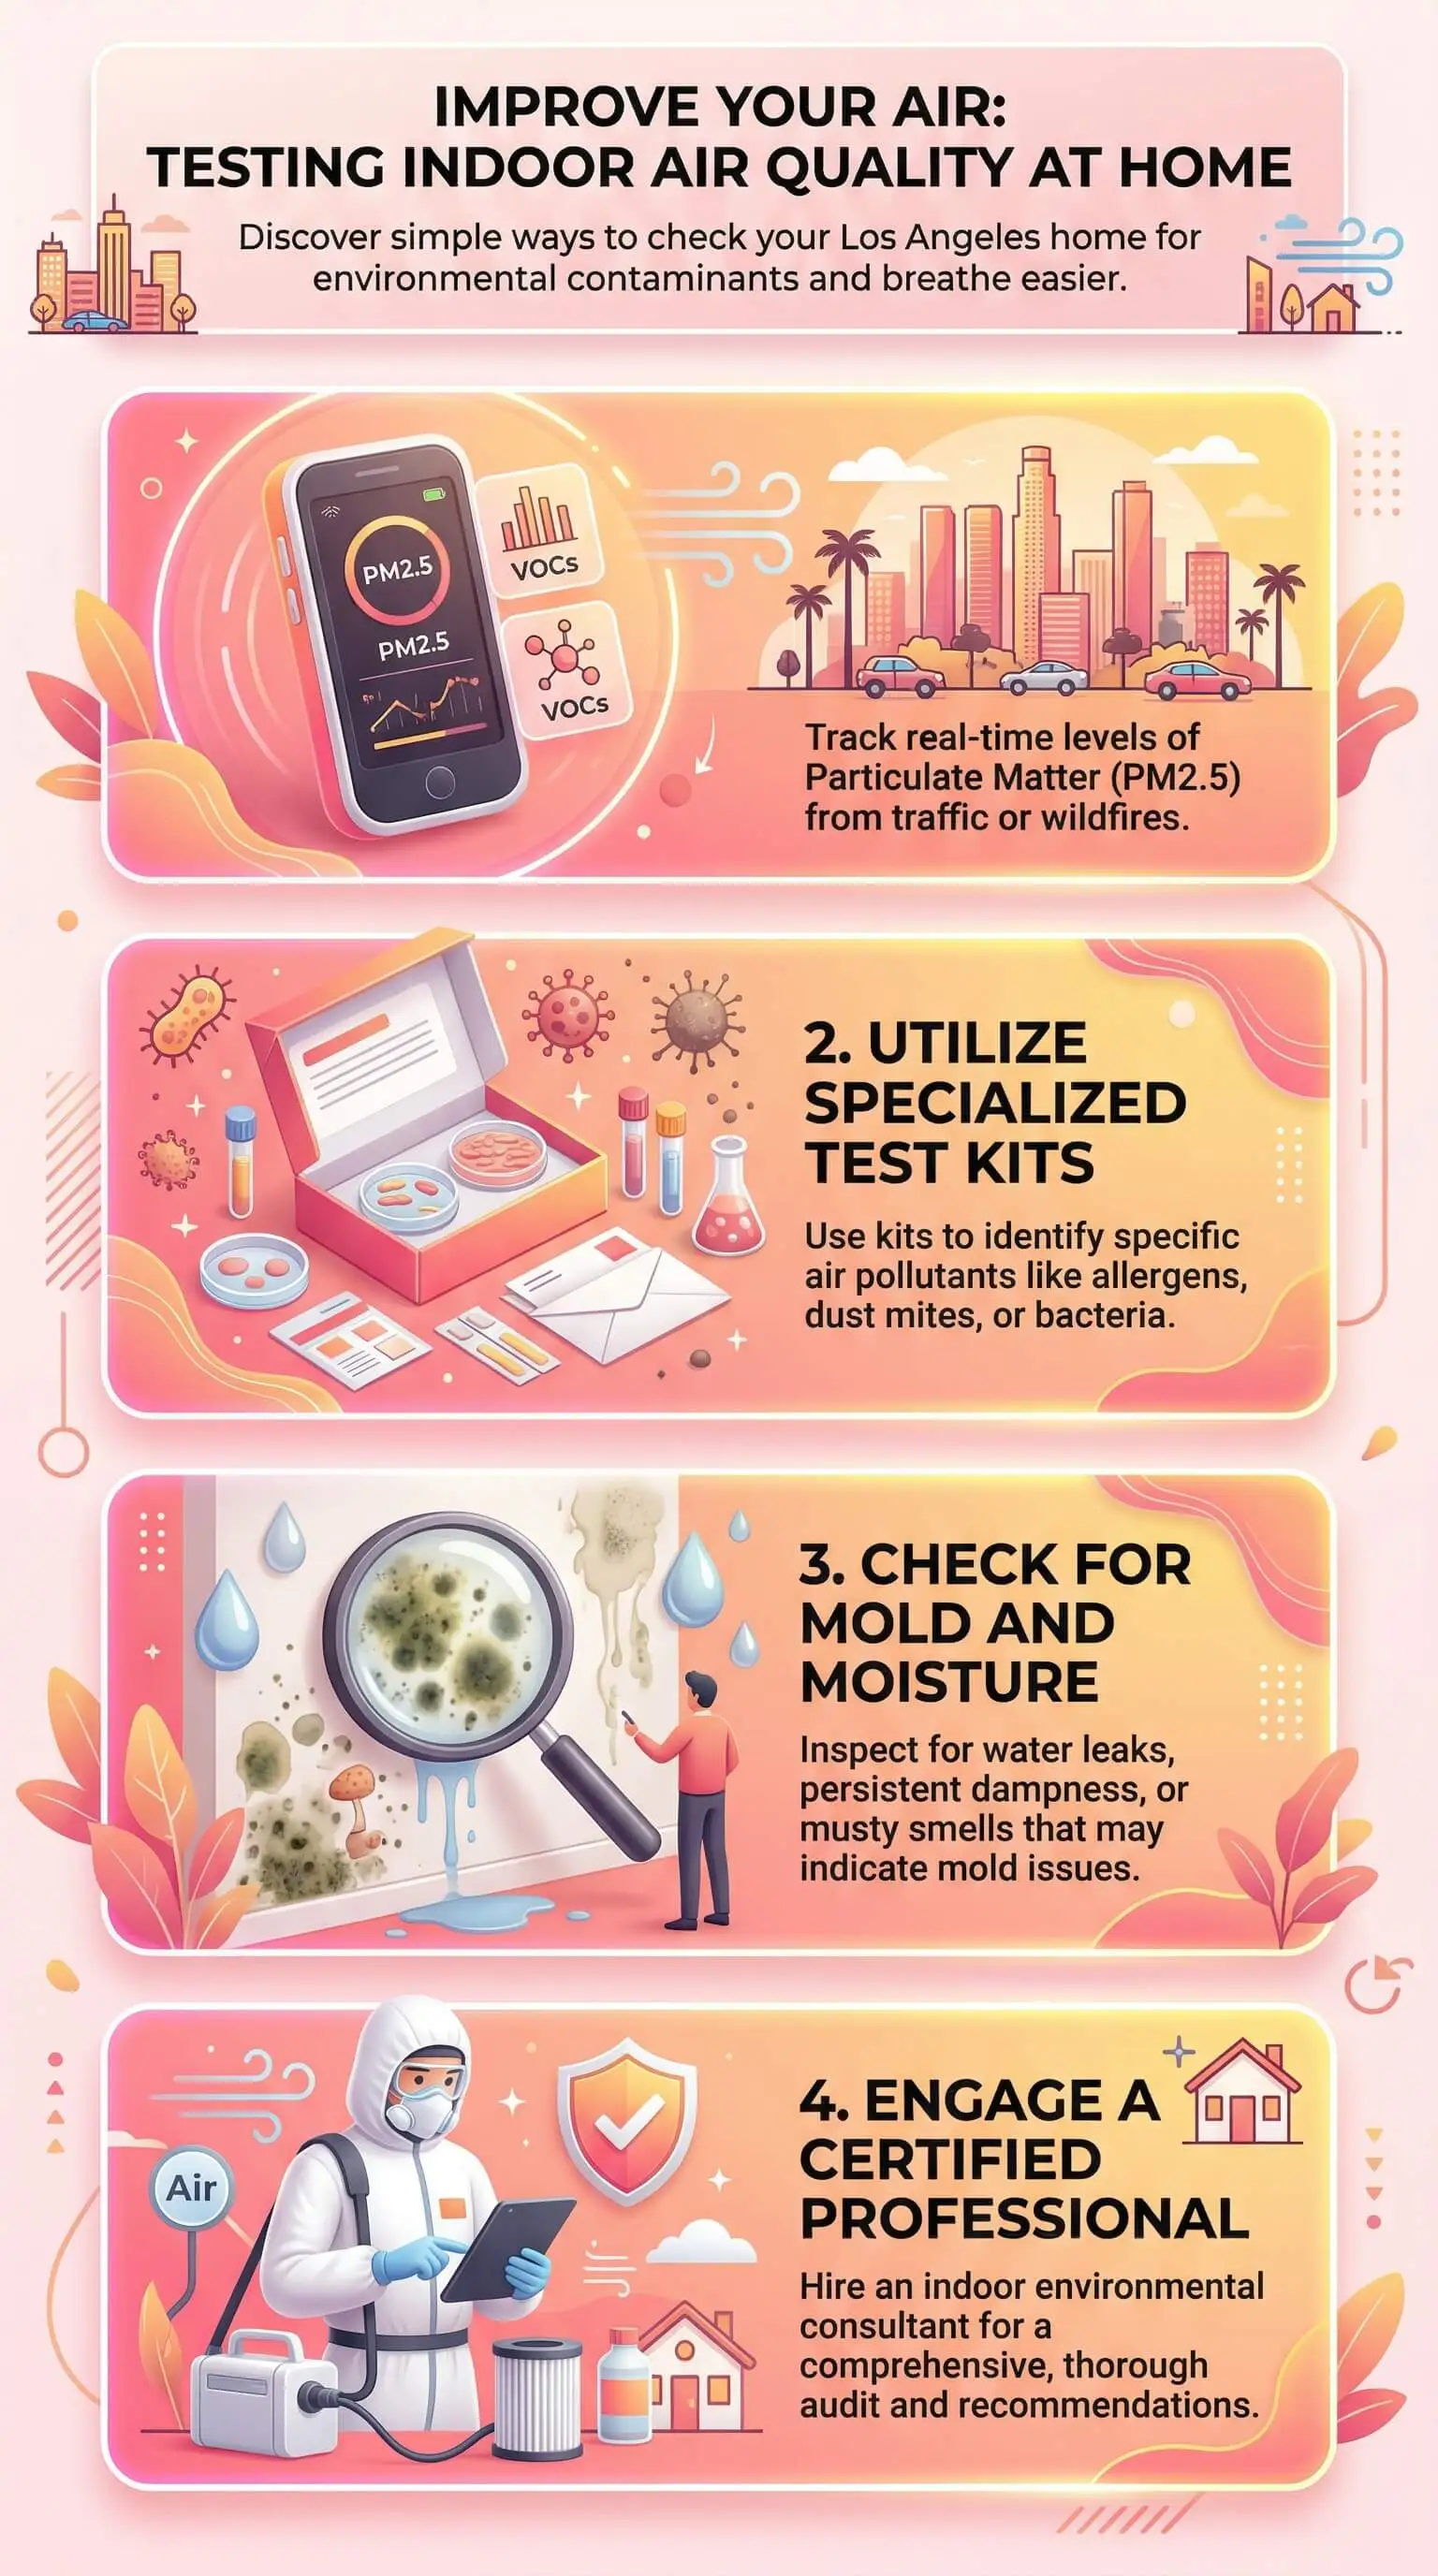
For most LA homeowners, a real-time IAQ monitor is the most practical starting point. These devices continuously measure key pollutant categories and display readings you can act on immediately.
Look for a monitor that measures:
PM2.5 — fine particulate matter, the primary pollutant in wildfire smoke and vehicle exhaust
VOCs (volatile organic compounds) — off-gassing from paints, furniture, cleaning products, and building materials
CO2 — a reliable proxy for ventilation quality and stale air buildup
Humidity — elevated humidity drives mold growth; low humidity worsens particulate suspension
Pro Tip: Place your monitor in the room where your family spends the most time — typically the main living area or a bedroom. After manufacturing and studying air filtration for over a decade, we've learned that readings vary significantly room by room. A single monitor placed in a hallway won't give you the full picture.
Method 2: Use a Home Test Kit for Specific Pollutants
When you need to identify a specific threat — not just general air quality — targeted home test kits offer a direct answer. These are particularly useful for LA homeowners in older properties or those recovering from wildfire smoke exposure.
Common home test kits include:
Mold test kits — capture airborne spores for lab analysis; useful for homes with moisture issues or visible growth
Radon test kits — passive charcoal canisters that measure radon accumulation over 2–7 days; critical for homes built on hillside lots or with basement-adjacent spaces
Formaldehyde test kits — relevant for newer homes with fresh building materials, engineered wood flooring, or recent renovations
Asbestos test kits — essential for any LA home built before 1980 before disturbing walls, flooring, or ceiling materials
Mail-in lab kits typically deliver results within a week and provide quantified levels — not just a pass/fail indicator — which allows you to prioritize your response based on severity.
Method 3: Schedule a Professional IAQ Assessment
For households dealing with persistent health symptoms, post-wildfire recovery, or suspected mold contamination, a professional IAQ assessment provides the most comprehensive picture. A certified inspector uses calibrated equipment to test for a broader range of pollutants than consumer monitors detect, and they can identify sources — not just concentrations.
A professional assessment is particularly worth the investment if:
A household member has asthma, COPD, or a compromised immune system
Your home sustained smoke infiltration during a recent wildfire event
You've noticed mold growth in multiple areas
Your HVAC system is more than 10 years old and has never been inspected for contamination
Look for inspectors certified by the American Industrial Hygiene Association (AIHA) or the Indoor Air Quality Association (IAQA). Request a written report with specific pollutant levels, identified sources, and prioritized remediation steps.
What Pollutants Should LA Homeowners Prioritize Testing For?
Not every home needs to test for every possible contaminant. Based on LA's specific environmental profile, we recommend prioritizing the following based on your home's age, location, and recent conditions:
PM2.5 — all LA homes, year-round; elevated during fire season (typically May through December)
Mold and moisture — coastal and hillside homes, properties with aging plumbing or flat roofing
Radon — homes in the San Fernando Valley, hillside communities, and areas with granite-rich soil
VOCs — recently renovated homes, homes with attached garages, or properties near industrial corridors
Lead dust — homes built before 1978, particularly those with original painted surfaces or recent renovation activity
Carbon monoxide — homes with gas appliances, attached garages, or older water heaters and furnaces
What to Do After You Get Your Test Results
Testing is only valuable if it leads to action. Here's how to interpret and respond to what you find:
Elevated PM2.5: Upgrade your HVAC filter to a MERV 13 rating. MERV 13 filters capture particles as small as 0.3 microns — the range where wildfire smoke and traffic exhaust particles are most concentrated. Replace filters more frequently during fire season.
High VOC levels: Improve ventilation, remove or isolate the off-gassing source, and consider an activated carbon air purifier for the affected rooms.
Mold detected: Address the moisture source before treating the mold itself. Mold remediation without fixing the underlying humidity or leak issue is a temporary fix.
Radon above 4 pCi/L: The EPA recommends mitigation at or above this level. A certified radon mitigation contractor can install a sub-slab depressurization system to reduce levels significantly.
Elevated CO2: Increase fresh air ventilation — open windows when outdoor AQI allows, or consider an energy recovery ventilator (ERV) to bring in filtered fresh air without losing conditioned air.
The goal isn't a perfect score. It's a clear, honest picture of what your family is breathing — and a specific plan to improve it.
"Most Los Angeles homeowners we talk to are surprised to learn their indoor air is often more polluted than the air outside — even on high-AQI days. After manufacturing air filters for over a decade and working with more than two million households across the country, we've seen firsthand how LA's unique combination of wildfire smoke, traffic exhaust, and aging housing stock creates an indoor air quality challenge unlike anywhere else. The homes that handle it best aren't the ones with the most expensive equipment — they're the ones where the homeowner took the time to test first and respond to what the data actually showed. That one step changes everything."
Essential Resources
Knowing your AQI number is only half the battle — knowing where to find it, how to read it, and how to act on it is what actually protects your family. After manufacturing air filters for over a decade and serving more than two million households, we've learned that the homeowners who stay ahead of poor air quality are the ones who have the right tools bookmarked before conditions get bad. These are the resources we trust most for LA-specific air quality data.
1. AirNow Interactive Map — The EPA's Official Starting Point for Real-Time AQI in Los Angeles
This is the first resource we point LA homeowners to when they want a reliable, government-backed snapshot of current air quality. The EPA's AirNow map displays live ozone and PM2.5 readings by zip code across the greater Los Angeles area — pulled directly from official monitoring stations, not third-party sensors.
2. AirNow Fire and Smoke Map — Know When Wildfire Smoke Is Heading for Your Neighborhood
In LA, wildfire smoke doesn't announce itself — it drifts in quietly through HVAC vents and window gaps, often before outdoor conditions look visibly severe. This EPA tool overlays live AQI data with active fire locations across California so you can see what's coming before it reaches your front door.
https://www.airnow.gov/wildfires/fire-and-smoke-map/
3. South Coast AQMD Current Air Quality Map — The Most Granular Neighborhood-Level AQI Map for the LA Basin
City-wide AQI averages don't tell the full story in a metro as large and varied as Los Angeles. The South Coast AQMD map blends regulatory monitor data with hundreds of low-cost sensors to generate real-time AQI readings at more than 1,000 locations across LA, Orange, San Bernardino, and Riverside counties — so you know what your specific neighborhood is breathing, not just the region.
https://www.aqmd.gov/home/air-quality/current-air-quality-data
4. South Coast AQMD Air Quality Forecasts — Stop Reacting to Bad Air Days and Start Anticipating Them
One of the most consistent insights we share with homeowners is this: the best time to protect your indoor air is before outdoor conditions deteriorate, not after. The South Coast AQMD publishes daily AQI forecasts for every monitoring subregion in LA County — giving you the lead time to close windows, adjust your HVAC settings, and check your filter before pollution levels peak.
https://www.aqmd.gov/home/air-quality/air-quality-forecasts
5. California Air Resources Board Air Quality Monitoring — Statewide Pollutant Data Backed by 50 Years of Monitoring
CARB has operated one of the most extensive air monitoring networks in the world for more than five decades. Their air quality monitoring hub provides real-time and historical pollutant concentration data across all California air districts — including the South Coast district covering LA County — making it the most authoritative source for tracking how your region's air quality is trending over time.
https://ww2.arb.ca.gov/our-work/topics/air-quality-monitoring
6. CARB AQview Air Quality Viewer — Localized Pollution Data for LA's Most Overburdened Communities
If you live in South LA, East LA, or another community with historically elevated pollution exposure, AQview gives you something most air quality tools don't: community-specific data collected at the neighborhood level through California's AB 617 program. The readings here often reveal a more accurate picture of what residents in these areas are actually breathing day to day.
7. EPA AQI Basics — Learn to Read the Index Before You Act on It
A map full of color-coded AQI numbers is only useful if you understand what they mean for your family's health. This EPA reference breaks down all six AQI categories, explains which pollutants drive the index on any given day, and outlines exactly when sensitive groups — including children, older adults, and anyone with asthma or heart disease — should take protective action indoors.
https://www.airnow.gov/aqi/aqi-basics/
Supporting Statistics
One of the most consistent things we hear from LA homeowners is that they feel safer indoors when outdoor air quality is poor. It's an understandable instinct — but after manufacturing air filters for over a decade and working with more than two million households, we've learned that closing the door doesn't close the gap.
Indoor air pollutant concentrations are often 2 to 5 times higher than outdoor levels — and in some cases, more than 100 times higher.
The EPA has documented that some indoor pollutant concentrations consistently run 2 to 5 times higher than outdoor levels — and in certain conditions, more than 100 times higher. This is the single most surprising finding we share with homeowners who diligently check outdoor AQI maps while never testing what's accumulating inside their own walls. Outdoor AQI data tells you what's happening at street level. It tells you nothing about:
Gases off-gassing from your flooring and furnishings
Combustion byproducts from your gas range
Particulates your HVAC system has been recirculating for months
Source: U.S. Environmental Protection Agency — Indoor Air Quality https://www.epa.gov/report-environment/indoor-air-quality
VOC concentrations inside your home can run up to 10 times higher than outdoor levels — even on clean air days.
EPA research confirms that VOC concentrations indoors consistently exceed outdoor levels, reaching up to ten times higher in homes nationwide. During activities like paint stripping, levels can spike to 1,000 times background outdoor concentrations. For LA homeowners specifically, two factors compound this risk:
Warm temperatures accelerate off-gassing from building materials and furnishings year-round
Attached garages — common throughout LA's residential neighborhoods — create direct pathways for vehicle exhaust VOCs to migrate into living spaces
Your outdoor AQI number will never reflect any of this. Only an indoor test will.
Source: U.S. Environmental Protection Agency — Volatile Organic Compounds' Impact on Indoor Air Quality https://www.epa.gov/indoor-air-quality-iaq/volatile-organic-compounds-impact-indoor-air-quality
A 10% reduction in PM2.5 could prevent more than 400 deaths per year in Los Angeles County.
The CDC's Environmental Public Health Tracking Network estimates that even a modest 10% reduction in fine particulate matter could prevent more than 400 deaths annually in LA County alone. We think about this statistic often — because MERV 13 filtration is one of the most accessible improvements any homeowner can make. Here's why it matters:
MERV 13 filters are specifically engineered to capture particles in the PM2.5 size range
A filter upgrade requires no professional installation and no structural changes to your home
At scale, across millions of households, better filtration creates meaningful, cumulative health outcomes
Source: CDC Environmental Public Health Tracking Network — Health Impacts of Fine Particles in Air https://ephtracking.cdc.gov/showAirHIA
7.3% of children in Los Angeles County have asthma — with the worst outcomes in neighborhoods closest to freeways and industrial corridors.
The LA County Department of Public Health's 2023 Health Survey found that 7.3% of children ages 0 to 17 in the county have asthma. The three primary indoor drivers identified in the report:
Mold and moisture from poor ventilation
Pest exposure linked to housing conditions
Proximity to high-traffic corridors and industrial pollution sources
This tracks with what we see in customer data. Households in high-traffic areas replace filters at significantly higher rates — and the particulate load captured by those filters tells its own story about what children in those homes are breathing between changes.
Source: Los Angeles County Department of Public Health — Breathless: Impact of Asthma on Children in Los Angeles County (2025) http://publichealth.lacounty.gov/phcommon/public/media/mediapubhpdetail.cfm?prid=5151
In Los Angeles, elevated ozone is associated with a 43% increased risk of dying from respiratory causes — far above the national average.
An EPA analysis found that every 10 parts per billion increase in average ozone concentrations corresponded to roughly a 4% increase in respiratory mortality nationally. In Los Angeles, that figure climbed to 43% — significantly higher than comparable figures for New York and Washington. Three factors drive LA's outsized ozone risk:
Basin geography traps pollutants and limits natural dispersal
Traffic density generates ozone precursors at a scale few metros match
Heat accelerates the atmospheric reactions that produce ground-level ozone
Monitoring outdoor AQI in Los Angeles is not enough if you don't also understand how those ozone levels are infiltrating and accumulating inside the one environment where your family spends the majority of their time.
Source: U.S. Environmental Protection Agency — Response to Comments, Volume 5 https://www.epa.gov/sites/default/files/2021-05/documents/rtc_volume_5.pdf
Final Thoughts
Testing your indoor air quality in Los Angeles isn't a precaution reserved for homeowners with known health concerns. It's a baseline act of household stewardship — as routine as inspecting your roof or changing your locks. After manufacturing air filters for over a decade and serving more than two million households, here is what we know about the gap between perception and reality when it comes to indoor air quality in LA:
Most homeowners overestimate how much outdoor AQI data tells them about their indoor environment
The pollutants most likely to affect your family's long-term health — VOCs, fine particulates, mold spores, radon — are invisible, odorless, and absent from every AQI map
The homes that handle LA's air quality challenges best are not the ones with the most sophisticated equipment — they are the ones where a homeowner tested first and responded to what the data showed
Small, consistent actions compound over time into meaningful protection for the people inside the home
Our perspective, shaped by years of direct experience with air filtration at scale: the outdoor AQI map is a starting point, not a finish line. It tells you what Los Angeles is dealing with as a region. It tells you nothing about the specific pollutants accumulating inside your specific home, with your specific building materials, appliances, and ventilation conditions.
The most valuable step any LA homeowner can take right now isn't finding the perfect air purifier or the highest-rated filter. It's this:
Test your indoor air — methodically, and room by room if necessary
Let the results drive every decision that follows
Treat filtration and monitoring as ongoing habits, not one-time fixes
Clean air is not a feature of a well-maintained home. It is the foundation of one — and air ionizer installation services can help support that foundation..
FAQ on Air Quality Index Map Los Angeles
Q: What is the most reliable air quality index map for Los Angeles?
A: Two resources stand out above the rest:
South Coast AQMD Current Air Quality Map (aqmd.gov) — The most granular option for the LA region. Pulls from regulatory monitors, hundreds of low-cost sensors, and forecast models. Generates real-time AQI readings at more than 1,000 locations across LA and surrounding counties.
EPA AirNow Interactive Map (airnow.gov) — Federally verified ozone and PM2.5 readings by zip code across the greater LA region.
In our experience, relying on a single source gives you an incomplete picture. Use both together — South Coast AQMD for neighborhood-level granularity, AirNow for federal verification.
Q: What does the AQI number on a Los Angeles air quality map actually mean for my family's health?
A: The AQI runs from 0 to 500 across six color-coded categories. Here is how to translate each into a household decision:
0–50 (Green — Good): No action needed. Safe for all groups.
51–100 (Yellow — Moderate): Safe for most. Sensitive individuals should monitor symptoms.
101–150 (Orange — Unhealthy for Sensitive Groups): Children, older adults, and anyone with asthma or heart disease should reduce outdoor exertion and run indoor filtration.
151–200 (Red — Unhealthy): Close windows. Switch HVAC to recirculate mode. Check your filter load.
201–300 (Purple — Very Unhealthy): Avoid outdoor activity. Run HEPA filtration in primary living spaces.
301–500 (Maroon — Hazardous): Emergency conditions. Stay indoors. Run filtration. Seal all windows and gaps.
During active wildfire events, LA AQI readings can move from Moderate to Hazardous within hours. Real-time monitoring is not optional during fire season.
Q: How often does the air quality index change in Los Angeles, and how frequently should I check the map?
A: AQI readings update hourly on both AirNow and South Coast AQMD maps. In LA's air environment, conditions can shift dramatically within a single day. Four factors drive that volatility:
Morning traffic emissions peak through the commute window
Afternoon heat accelerates ground-level ozone formation across the basin
Evening Santa Ana wind events push particulates rapidly across neighborhoods
Overnight wildfire smoke migrates into the region before most families are aware
How often to check:
Stable weather, no active fires: A morning check is sufficient to plan your day.
Fire season (May through December): Check every few hours. Catching deteriorating conditions early is the difference between protecting your indoor air before smoke infiltrates — not after.
Q: Can a Los Angeles air quality index map tell me about the air quality inside my home?
A: No — and this distinction matters more in Los Angeles than almost anywhere else in the country. AQI maps measure outdoor air at fixed monitoring locations. They capture nothing about what is happening inside your home. The pollutants most likely to affect your family's long-term health are almost never reflected in outdoor AQI readings:
VOCs off-gassing from flooring, furniture, and building materials
Combustion byproducts from gas appliances, fireplaces, and water heaters
Mold spores, radon, and biological contaminants generated within the home
Fine particulates recirculated by an HVAC system with an overloaded or low-rated filter
The EPA has documented that indoor pollutant concentrations are often 2 to 5 times higher than outdoor levels. A favorable AQI reading tells you conditions are acceptable outside. It tells you nothing about what your family is breathing indoors. The only way to know is to test.
Q: What should I do when the air quality index map shows unhealthy levels in Los Angeles?
A: When the AQI map shows Orange or above, move through these steps in order:
Close all windows and doors immediately to limit PM2.5 and ozone infiltration. Do not wait for conditions to worsen.
Switch your HVAC to recirculate mode to stop drawing in outdoor air. Verify your filter is rated MERV 13 or higher.
Check your filter load. During high-AQI and wildfire events, filters accumulate particulates significantly faster than normal. A filter weeks from its scheduled change may already be heavily loaded.
Run a HEPA air purifier in the rooms where your family spends the most time — particularly bedrooms and main living areas.
Monitor indoor air in real time using an IAQ monitor. Confirm your filtration is bringing indoor pollutant levels down — do not assume it is.
Protect sensitive household members first. Children, older adults, and anyone with asthma, COPD, or heart disease remain vulnerable to elevated indoor particulate levels even with windows closed during severe events.
Take Control of the Air Inside Your Los Angeles Home
Now that you know how to test your indoor air quality, the next step is making sure your HVAC system is equipped to handle what the tests reveal. Explore Filterbuy's MERV filters — engineered to capture the fine particulates, wildfire smoke, and traffic exhaust pollutants that define Los Angeles air quality challenges.